Data Freshness SLAs in Modern Analytics Stacks
Catch stale data before it cascades through your entire stack.
A Salesforce sync breaks on a Friday afternoon. By Monday morning, sales leadership stands in front of the board presenting pipeline numbers that are three days stale, and nobody raised a flag, because no pipeline technically failed. That is the gap this piece is about: the distance between a pipeline that completes and a pipeline that honors its obligation to the business.
Most observability tooling in a modern data stack watches for errors and completion. It checks whether a job ran, whether it finished within its window, whether rows landed where they were supposed to land. None of that tells anyone whether the data inside those rows reflects what happened in the real world an hour ago or three days ago. A green dashboard and a stale table can coexist indefinitely, and they will, until someone downstream notices the numbers don't match reality and starts asking uncomfortable questions in a meeting.
The reason this gap persists is structural. A pipeline's completion time sits in neither the moment an event happened in the source system nor the moment a stakeholder acts on the resulting report. It measures something adjacent to both and equivalent to neither. Closing that gap requires a different definition of freshness than the one most teams currently monitor against, and it requires enforcing that definition somewhere other than where most teams currently enforce it.
What freshness measures: event time, not load time
Data freshness, properly measured, is the age of the newest record by its business event timestamp. It is not the time the pipeline last ran, and it is not the time the warehouse table was last written. Those two measurements feel like proxies for freshness, and treating them as such is the mistake that let the Salesforce sync failure go unnoticed over an entire weekend.
Every pipeline produces at least three distinct timestamps, and each one answers a different question. Confusing those two gaps, or monitoring only one while believing it captures both, is how a pipeline can look perfectly healthy while delivering information nobody can use.
Table modification timestamps compound the problem, because they lie by omission. A pipeline that checks a column like LAST_ALTER_TIME and calls that freshness is reporting an update that never actually delivered fresh data. The Salesforce sync in the opening scenario could have had a table that looked recently touched on Saturday night even though the actual customer events it was supposed to capture stopped arriving on Friday afternoon.
Any SLA contract that does not anchor itself to source-system event timestamps will produce readings that are systematically optimistic, not occasionally wrong in random directions but biased toward telling teams their data is fresher than it is. A monitoring system with a consistent optimistic bias earns trust it has not earned, and that trust costs the business when someone makes a decision on data that was already stale when they saw it.
A single freshness threshold per table fails both teams that set it
Once freshness is correctly anchored to event time, the next question is whose event time matters, and the answer reveals why a single threshold per table cannot work. A single freshness threshold applied to an entire table is either too strict for some consumers, which produces constant and unnecessary alerts, or too lenient for others, which lets genuine violations pass unflagged. The unit an SLA needs to be defined against is the pairing of an asset with a specific consumer, not the table in isolation.
Consider an orders table feeding two very different audiences. A real-time operations dashboard built on that table needs freshness within minutes to reflect current fulfillment status. One data engineering guide puts the problem directly: different consumers of the same table often have different SLA requirements, and finance closing reports can tolerate T+1 data in a way that a real-time operations dashboard cannot. A single threshold set to satisfy both will fail one of them by design.
The two failure directions have different costs, and both are expensive. Setting the threshold loose enough to avoid bothering the finance team makes the real-time dashboard's SLA silently fail every time the pipeline runs on its normal, unremarkable schedule.
Making SLA definitions explicit, per-asset, and per-consumer, and storing them in a form a machine can check rather than a form that lives in someone's memory, is the only way out of that trap. That means a config file living in the data-ops repository or alongside the transformation project, version-controlled the same way the pipeline code itself is version-controlled. An SLA that exists only as a verbal understanding, something like "it should update pretty often," is a wish, and wishes cannot be monitored, cannot be escalated when they're violated, and cannot be handed off when the person who made the promise leaves the team.
Tiering SLAs by business use case rather than by gut feel
SLA tiers need to come from business impact, not from whatever the pipeline happens to deliver today out of technical convenience. One freshness monitoring guide states this directly: service level agreements for data freshness should be derived from business requirements, not arbitrary technical targets, and the process has to start with an honest look at how the data actually gets consumed.
A workable structure uses four tiers, organized by the urgency of the decisions the data supports. The first tier covers operational real-time use cases: fraud detection, live inventory counts, dynamic pricing engines. The second tier covers near-real-time analytics: marketing funnel tracking, user activity dashboards, A/B test evaluation. The third tier covers daily reporting: revenue aggregates, executive dashboards, compliance snapshots. No active freshness SLA is required here at all, because completeness and accuracy matter far more than recency.
The question that sorts any given dataset into the right tier is simple to state and hard to answer honestly: what decision does this data support, and what does it cost if that decision is wrong by an hour, a day, or a week? Teams that skip this question tend to default every table to the tightest tier out of caution, which produces alert fatigue, or to the loosest tier out of convenience, which quietly reintroduces a stale-data problem under a different name.
Monitoring cadence has to follow the tier once it's chosen. One widely cited guide specifies that freshness checks should run at least twice as frequently as the SLA window itself: a one-hour SLA requires checks running comfortably inside that hour, not at the sixty-minute mark where a violation would already be irreversible by the time it's caught. These four tiers are a starting framework, not a fixed taxonomy. Organizations at real scale, handling tens of thousands of tables, have had to build their own classification systems around consumption patterns specific to their business, and any team adopting a tiered structure should expect to calibrate it against its own mix of consumers rather than treating four categories as universal law.
Enforcement at the replication layer, before transformation runs
Everything established so far, the right definition of freshness and the right granularity for an SLA, still fails if enforcement happens in the wrong place. A freshness SLA checked only after transformation has already been violated by the time anyone looks at it. Enforcement has to happen at the replication layer, upstream of transformation, where stale data can be caught before it joins, aggregates, and propagates into every model and dashboard built on top of it.
The cascade effect makes enforcement at this layer non-negotiable. A single delayed or stale source can impact dozens of downstream models and reports simultaneously, and one widely used transformation framework's own SLA guidance acknowledges exactly this dynamic. By the time a quality check running at the transformation layer fires, the stale data has usually already been joined against other tables, aggregated into summary metrics, and served to a dashboard somewhere. The check caught the problem after it had already caused the damage it exists to prevent.
Log-based change data capture is the architecture that makes earlier enforcement possible. It reads the database's own transaction log, whether that's a write-ahead log, a binary log, or an oplog, in near-real time, capturing every insert, update, and delete as it commits. The pipeline built on this foundation receives a continuous stream of events rather than a periodic snapshot taken on some schedule. Freshness, in that architecture, becomes a property of the stream itself rather than a report card issued only when a batch job happens to finish.
Query-based polling cannot deliver the same guarantee, because it inherently introduces a polling interval between checks. Each poll also places direct CPU load on the production database being queried, which creates pressure to poll less frequently, which widens the very interval that was already hiding changes.
A managed, continuous replication service that streams database changes to the warehouse as they happen gives a team a freshness guarantee at the point of ingestion itself. The transformation layer downstream then operates on data whose age is already bounded by that guarantee, and if an SLA is breached from that point forward, the breach is a replication problem rather than a transformation problem, which matters enormously for how fast a team can diagnose it. The natural objection here is that checks and real-time pipelines add overhead that could itself threaten freshness. That objection holds for row-level quality scans, which are expensive, but checks at the replication layer are lightweight comparisons of event-time watermarks, and the latency they add is negligible set against the cost of letting stale data reach transformation unchecked.
Schema evolution as the silent SLA killer replication must also absorb
Schema changes at the source are among the most common causes of freshness SLA violations, and they expose a weakness in replication architecture that has nothing to do with volume or latency. A replication layer that cannot absorb a schema change automatically passes that fragility straight through to every consumer downstream, usually without any clear signal that anything has gone wrong.
PostgreSQL's logical replication illustrates the mechanism precisely. It does not replicate DDL by design. A column added to the publisher has to be applied separately to the subscriber before replication of new rows containing that column can succeed. If that manual step gets missed, replication doesn't just quietly fall behind, it errors out, logging the specific missing column by name, and the apply process either halts or enters a retry loop that never resolves itself. Downstream consumers see no new data arriving at all, while the pipeline's own status indicators may still suggest everything is operating normally.
A managed migration service offered by a major cloud provider shows the same fragility from a different angle, and the limitation is well documented and instructive. Dropping columns and altering data types are listed as supported operations, yet both can cause a replication task to suspend or halt entirely when the change proves incompatible with the target or arrives alongside a sequence of other DDL changes in close succession.
What a replication layer needs, to actually absorb this class of failure rather than transfer it downstream, is automated detection of DDL events straight from the transaction log, paired with transparent propagation of those changes to the destination, without requiring a human to intervene or a pipeline to be restarted by hand. Exactly-once delivery semantics also matter, and they're easy to overlook. A replication layer that handles schema changes correctly but duplicates or drops rows around the moment of that change has still broken the SLA contract, just through a different mechanism than the one that broke it before.
Composite SLA monitoring across a multi-stage pipeline
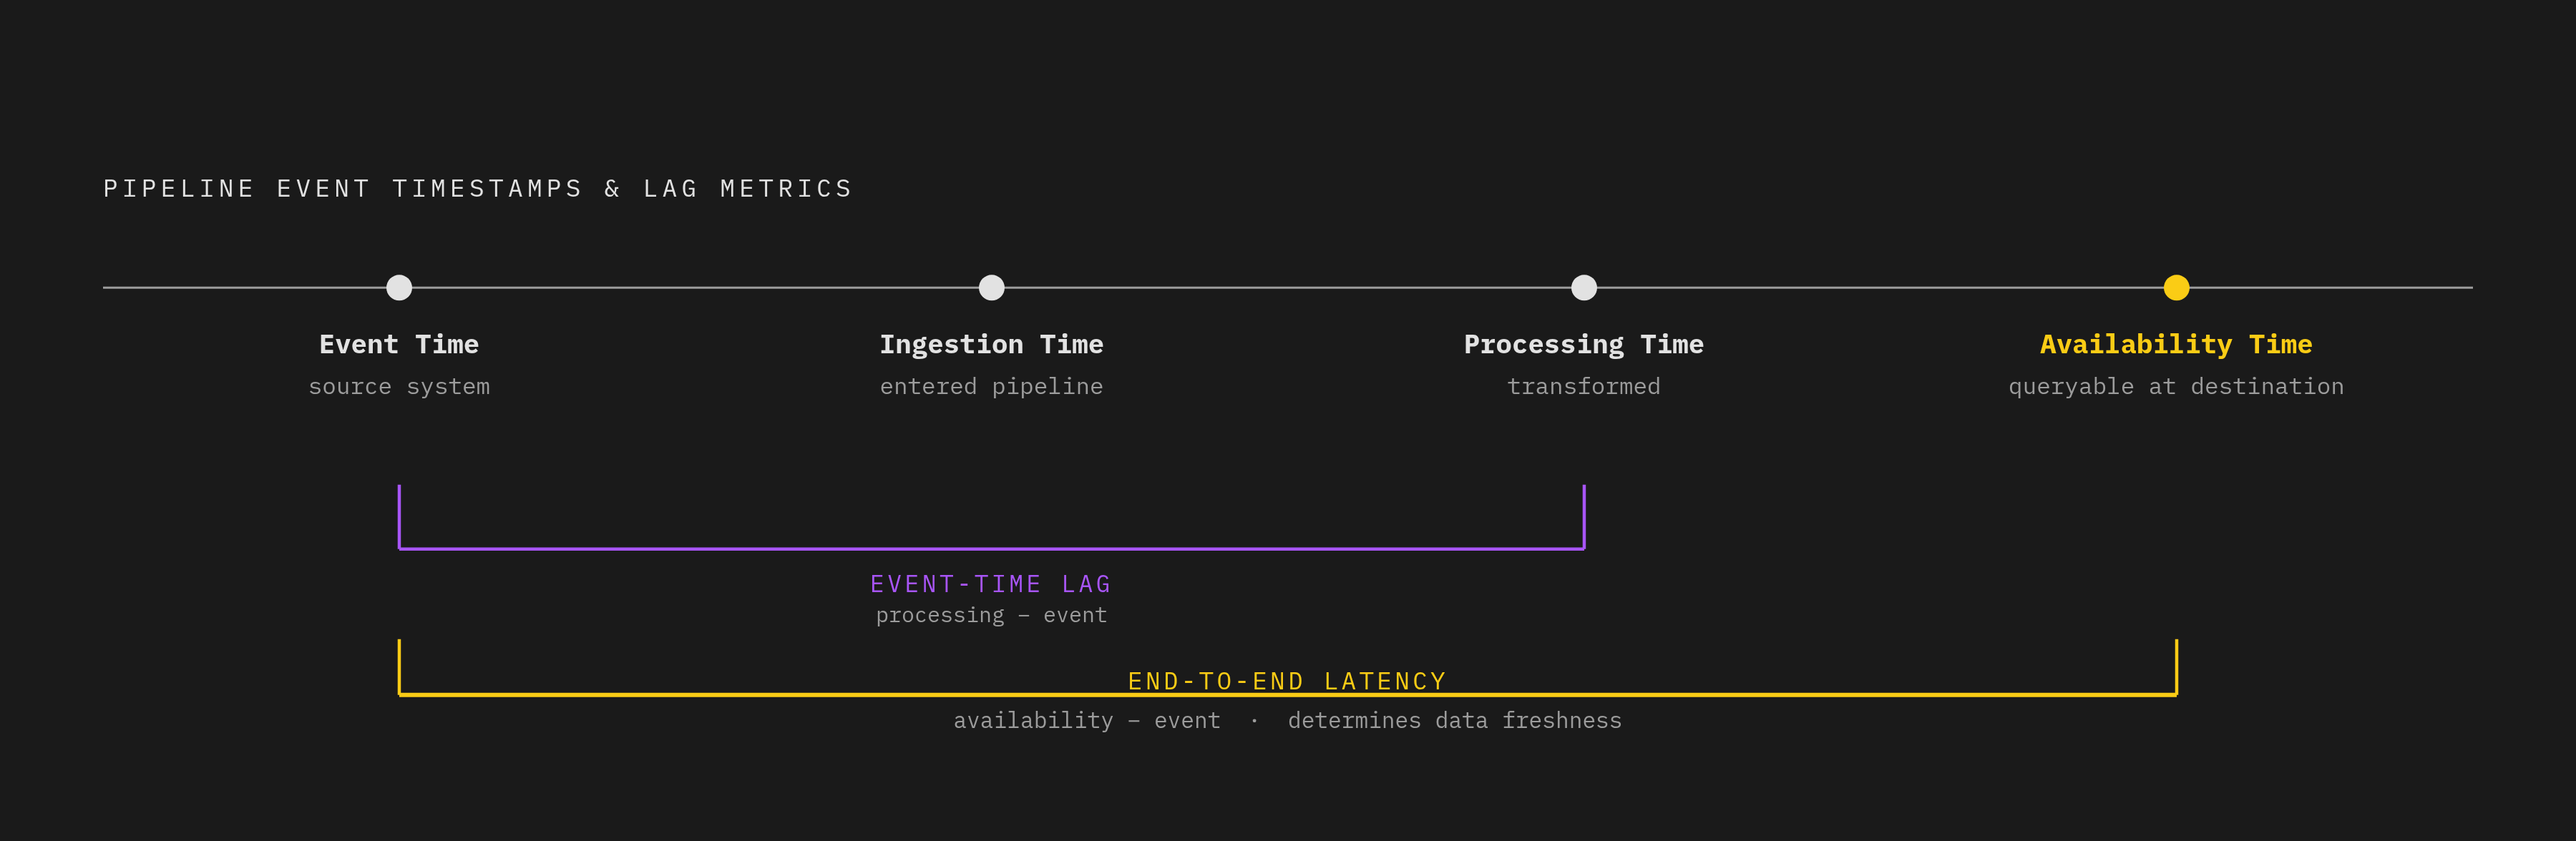
Instrumenting freshness properly means measuring each stage of a pipeline on its own terms, because the location of a violation determines its remedy, and a single end-to-end number cannot tell a team whether the source was slow or the sink was slow. Every event moving through a pipeline should carry four timestamps: event time, marking when it happened in the source system; ingestion time, marking when it entered the pipeline; processing time, marking when it was transformed; and availability time, marking when it became queryable at the destination.
Two metrics fall directly out of those four timestamps, and both are necessary because they catch different failures. Event-time lag is processing time minus event time, and it catches a pipeline that has slowed down internally. End-to-end latency is availability time minus event time, and it catches a destination or sink that has become slow to write, even when everything upstream of it is healthy. A team watching only one of these two numbers will misdiagnose roughly half of the failures it eventually encounters.
This is what composite SLA monitoring looks like in practice: each stage carries its own sub-SLA, and the overall freshness SLA is only satisfied when every individual stage satisfies its own component. Without that stage-by-stage breakdown, every investigation starts from zero.
One concrete pattern makes this queryable rather than something that has to be reconstructed after the fact: a table in a warehouse like Snowflake or BigQuery can carry all four timestamps directly, plus a computed column expressing event-to-available latency in milliseconds. Freshness, built this way, becomes a property of the data itself, something a query can retrieve directly rather than an external metric someone has to go correlate by hand across separate systems.
Alerting has to be tuned to intervene before a breach happens, not to report one after the fact. Observability built this way has to span the full pipeline, not stop at the transformation stage, because the relationships and dependencies between stages are where most freshness failures actually originate, and a tool watching only one stage will keep missing them.